 Duneanalytics
 dashboards
Dune, formerly Dune Analytics, presents SQL query results as charts grouped into dashboards. Trust in a chart depends on its metric definition, covered activity and data cut-off. Public query SQL lets you inspect those choices; the chart’s title and appearance don’t establish whether its calculation matches your question.
From Onchain Records to a Dashboard
| Stage | Output | Limit on interpretation |
|---|---|---|
| Recorded activity | Blockchain transactions and contract events, where emitted. | Transactions and events describe different units of activity. |
| Dataset | Tables of raw, decoded or curated data. | The selected table’s network and protocol coverage bounds the analysis. |
| SQL definition | A metric defined through filters and aggregation. | The calculation applies to its chosen population, period and unit. |
| Execution | Query results calculated from available records. | A recent execution doesn’t establish that every input is up to date. |
| Visualization | Query results displayed as a chart. | Labels and axes need to preserve the calculation’s meaning. |
| Dashboard | Visualizations assembled into a shared presentation. | Adjacent charts can retain different definitions and data cut-offs. |
Metrics Behind the Headline
A dashboard’s metric needs a defined population and unit. A protocol activity chart can cover selected contracts, versions and networks, so its headline needs to be read alongside those filters. A figure labelled "users" also needs to explain which addresses qualify and whether the count is cumulative or restricted to the displayed period. An address count doesn’t establish how many individual people participated.
Dollar volume measures a different aspect of activity from a transaction count. Dune’s EVM DEX trade schema defines
amount_usd
as the trade’s USD value at execution, while token-amount fields describe token quantities. A rise in dollar volume alone doesn’t establish growth in the number of participants or an increase in protocol revenue.
Data Timing and Partial Periods
A query’s execution time and the time of its underlying records answer different questions. A newly executed query can read delayed inputs, while fresh source tables can sit behind an older result. Charts on the same dashboard can consequently represent different effective cut-offs.
A historical report can intentionally stop at an earlier date. A chart describing current activity needs a data cut-off recent enough for that question, alongside a clear time filter. The newest event represented in a filtered result doesn’t, by itself, reveal the freshness of the entire source table.
Dune’s EVM and Solana DEX trade schemas record event dates and times in UTC. When a query groups those UTC fields into daily totals, the day boundary is UTC. An unfinished day’s total covers less time than a completed day’s total, so a lower bar alone doesn’t establish a decline in activity.
Overlapping Views of the Same Activity
Two dashboard totals can differ because their queries cover different contract sets, networks, protocol versions or time boundaries. Before treating the difference as a disagreement about performance, compare those definitions and the units each chart reports.
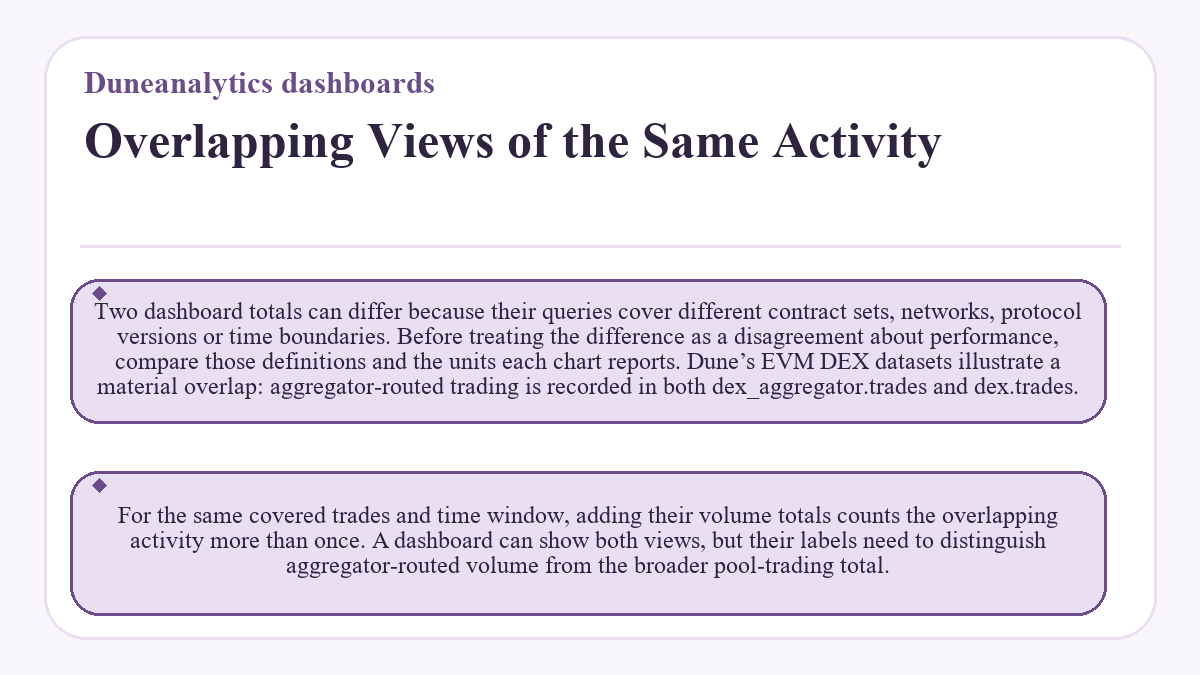
Dune’s EVM DEX datasets illustrate a material overlap: aggregator-routed trading is recorded in both
dex_aggregator.trades
and
dex.trades
. For the same covered trades and time window, adding their volume totals counts the overlapping activity more than once. A dashboard can show both views, but their labels need to distinguish aggregator-routed volume from the broader pool-trading total.
Visible Charts and Private Queries
A visible chart doesn’t guarantee public access to its SQL. Dune’s Application Service Addendum, updated May 13, 2026, says visualizations of private queries can be visible to others when added to a dashboard or embedded elsewhere. The query itself remains inaccessible to the public.
A creator’s explanation can describe the metric, but the chart alone doesn’t expose the SQL logic for inspection. Public dashboard viewing is free; executing SQL is separate and requires a paid plan or an active trial within its execution limits.